You can now view the Wait Events in PoWA thanks to the pg_wait_sampling extension.
Wait Events & pg_wait_sampling
Wait events are a famous and useful feature in a lot of RDBMS. They have been
added in PostgreSQL
9.6, quite a few
versions ago. Unlike most of others PostgreSQL statistics, those are only an
instant view of what the processes are currently waiting on, and not some
cumulated counters. You can get those event using the pg_stat_activity view,
for instance:
=# SELECT datid, pid, wait_event_type, wait_event, query FROM pg_stat_activity;
 datid  |  pid  | wait_event_type |     wait_event      |                                  query
--------+-------+-----------------+---------------------+-------------------------------------------------------------------------
 <NULL> | 13782 | Activity        | AutoVacuumMain      |
  16384 | 16615 | Lock            | relation            | SELECT * FROM t1;
  16384 | 16621 | Client          | ClientRead          | LOCK TABLE t1;
 847842 | 16763 | LWLock          | WALWriteLock        | END;
 847842 | 16764 | Lock            | transactionid       | UPDATE pgbench_branches SET bbalance = bbalance + 1229 WHERE bid = 1;
 847842 | 16766 | LWLock          | WALWriteLock        | END;
 847842 | 16767 | Lock            | transactionid       | UPDATE pgbench_tellers SET tbalance = tbalance + 3383 WHERE tid = 86;
 847842 | 16769 | Lock            | transactionid       | UPDATE pgbench_branches SET bbalance = bbalance + -3786 WHERE bid = 10;
[...]
In this example, we can see that the wait event for pid 16615 is a Lock on
a Relation. In other words, the query is blocked waiting for a heavyweight
lock, while the pid 16621, which obviously holds the lock, is idle waiting for
client commands. This is something we could already see in previous version,
though in a different manner. But more interesting, we can also see that the
wait event for pid 16766 is a LWLock, or a Lightweight Lock. Those are
internal transient locks that you previsouly couldn’t see at the SQL level. In
this example, the query is waiting for the WALWriteLock, a lightweight lock
mainly used to control the write to WAL buffers. A complete list of the
available wait events is available on the official
documentation.
Those information were lacking and are helpful to diagnose bottlenecks.
However, only having an instant view of those wait events is certainly not
enough to have a good idea of what’s happening on a server. Since most of the
wait events are by nature transient events, what you need is to sample them at
some high frequency. Trying to sample them with some external tool, even at a
second interval, is usually not enough. That’s where the pg_wait_sampling
extension bring a really
cool solution. It’s an extension written by Alexander
Korotkov and Ildus Kurbangaliev. Once activated
(it requires to be setup in shared_preload_libraries, so a PostgreSQL restart
is necessary), it’ll sample the wait events in shared memory every 10 ms
(by default), and also aggregate the counters per wait_event_type,
wait_event, pid and queryid (if pg_stat_statements is also activated). For
more details on how to configure and use it, you can refer to the extension’s
README.
Since the work is done in memory as a C extension, it’s very efficient. It’s
also implemented with very few locking, so its overhead should be almost
negligible. I did some benchmarking on my laptop (I unfortunately don’t have
better machine to test on) with a read-only
pgbench where
all the data fit in shared_memory, with both 8 and 90 clients, to try to get
a maximal overhead. The average of 3 runs was around 1%, while the
fluctuations between runs was around 0.8%.
And PoWA?
So, thanks to this extension, we now have a cumulated and extremely precise view of the wait events. That’s quite nice, but as the other cumulated statistics available in PostgreSQL, you need to sample the counters regularly if you want to be able to know what happened at a given time in the past, as stated in the README:
[…] Waits profile. It’s implemented as in-memory hash table where count of samples are accumulated per each process and each wait event (and each query with
pg_stat_statements). This hash table can be reset by user request. Assuming there is a client who periodically dumps profile and resets it, user can have statistics of intensivity of wait events among time.
That’s exactly the aim of PoWA: save the statistic counters in an efficient way and display them on a GUI.
PoWA 3.2 will automatically detect if the pg_wait_sampling extension is already present or if you install it subsequently and will start to snapshot its data, giving a really precise view of the wait events on your databases over time!
The data is gathered in standard PoWA tables, powa_wait_sampling_history_current
for the last 100 (default powa.coalesce) snapshots, and the older values are
aggregated in powa_wait_sampling_history, with up to powa.retention
history. For instance, here’s a simple query displaying the first 20 changes
that occured in the last 100 snapshots:
WITH s AS (
SELECT (record).ts, queryid, event_type, event,
(record).count - lag((record).count)
    OVER (PARTITION BY queryid, event_type, event ORDER BY (record).ts)
    AS events
FROM powa_wait_sampling_history_current w
JOIN pg_database d ON d.oid = w.dbid
WHERE d.datname = 'bench'
)
SELECT *
FROM s
WHERE events != 0
ORDER BY ts ASC, event DESC
LIMIT 20;
              ts               |       queryid        | event_type |     event      | events
-------------------------------+----------------------+------------+----------------+--------
 2018-07-09 10:44:08.037191+02 | -6531859117817823569 | LWLock     | pg_qualstats   |   1233
 2018-07-09 10:44:28.035212+02 |  8851222058009799098 | Lock       | tuple          |      4
 2018-07-09 10:44:28.035212+02 | -6860707137622661878 | Lock       | tuple          |    149
 2018-07-09 10:44:28.035212+02 |  8851222058009799098 | Lock       | transactionid  |    193
 2018-07-09 10:44:28.035212+02 | -6860707137622661878 | Lock       | transactionid  |   1143
 2018-07-09 10:44:28.035212+02 | -6531859117817823569 | LWLock     | pg_qualstats   |      1
 2018-07-09 10:44:28.035212+02 |  8851222058009799098 | LWLock     | lock_manager   |      2
 2018-07-09 10:44:28.035212+02 | -6860707137622661878 | LWLock     | lock_manager   |      3
 2018-07-09 10:44:28.035212+02 | -6860707137622661878 | LWLock     | buffer_content |      2
 2018-07-09 10:44:48.037205+02 |  8851222058009799098 | Lock       | tuple          |     14
 2018-07-09 10:44:48.037205+02 | -6860707137622661878 | Lock       | tuple          |    335
 2018-07-09 10:44:48.037205+02 | -6860707137622661878 | Lock       | transactionid  |   2604
 2018-07-09 10:44:48.037205+02 |  8851222058009799098 | Lock       | transactionid  |    384
 2018-07-09 10:44:48.037205+02 | -6860707137622661878 | LWLock     | lock_manager   |     13
 2018-07-09 10:44:48.037205+02 |  8851222058009799098 | LWLock     | lock_manager   |      4
 2018-07-09 10:44:48.037205+02 |  8221555873158496753 | IO         | DataFileExtend |      1
 2018-07-09 10:44:48.037205+02 | -6860707137622661878 | LWLock     | buffer_content |      4
 2018-07-09 10:45:08.032938+02 |  8851222058009799098 | Lock       | tuple          |      5
 2018-07-09 10:45:08.032938+02 | -6860707137622661878 | Lock       | tuple          |    312
 2018-07-09 10:45:08.032938+02 | -6860707137622661878 | Lock       | transactionid  |   2586
(20 rows)
NOTE: There’s also a per-database version of those metrics for easier
computation at the database level in powa_wait_sampling_history_current_db
and powa_wait_sampling_history_db
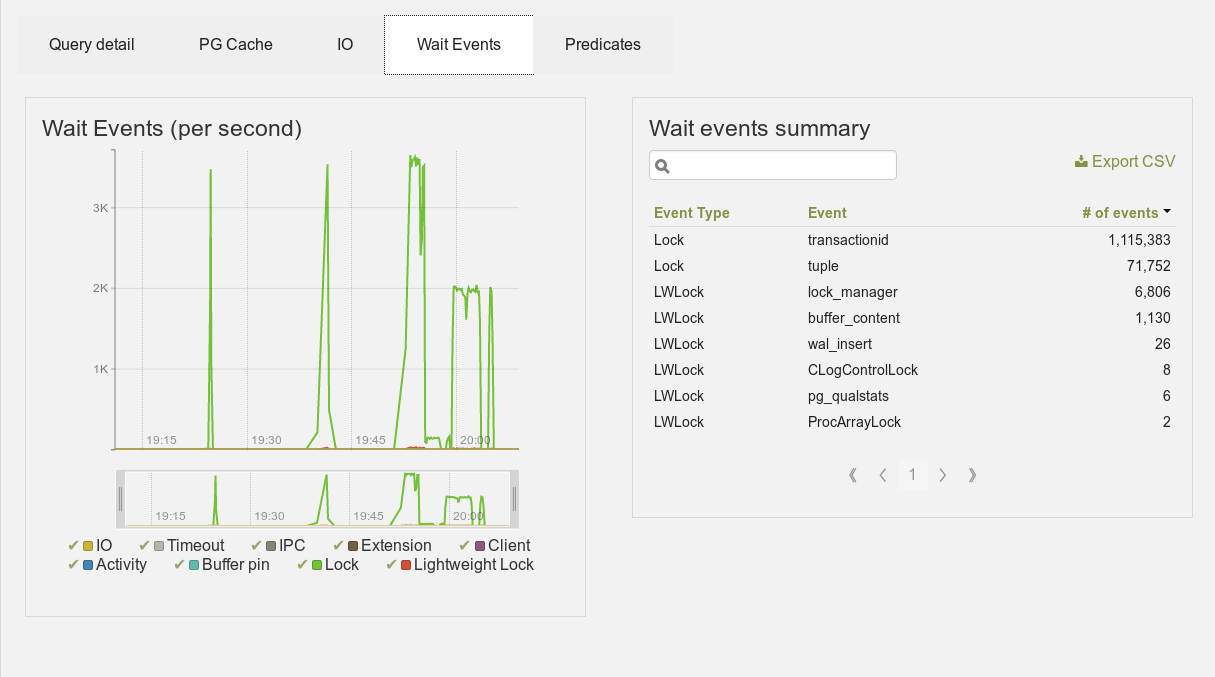
And they are visible in the powa-web interface. Here are some examples of the wait event display with a simple pgbench run:
Wait events for the whole cluster
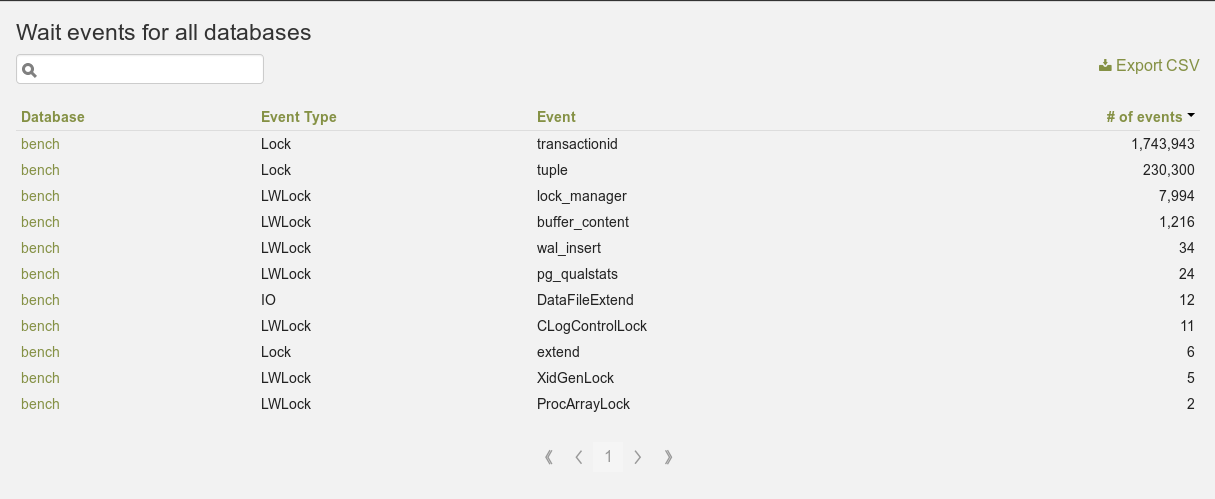
Wait events for a database
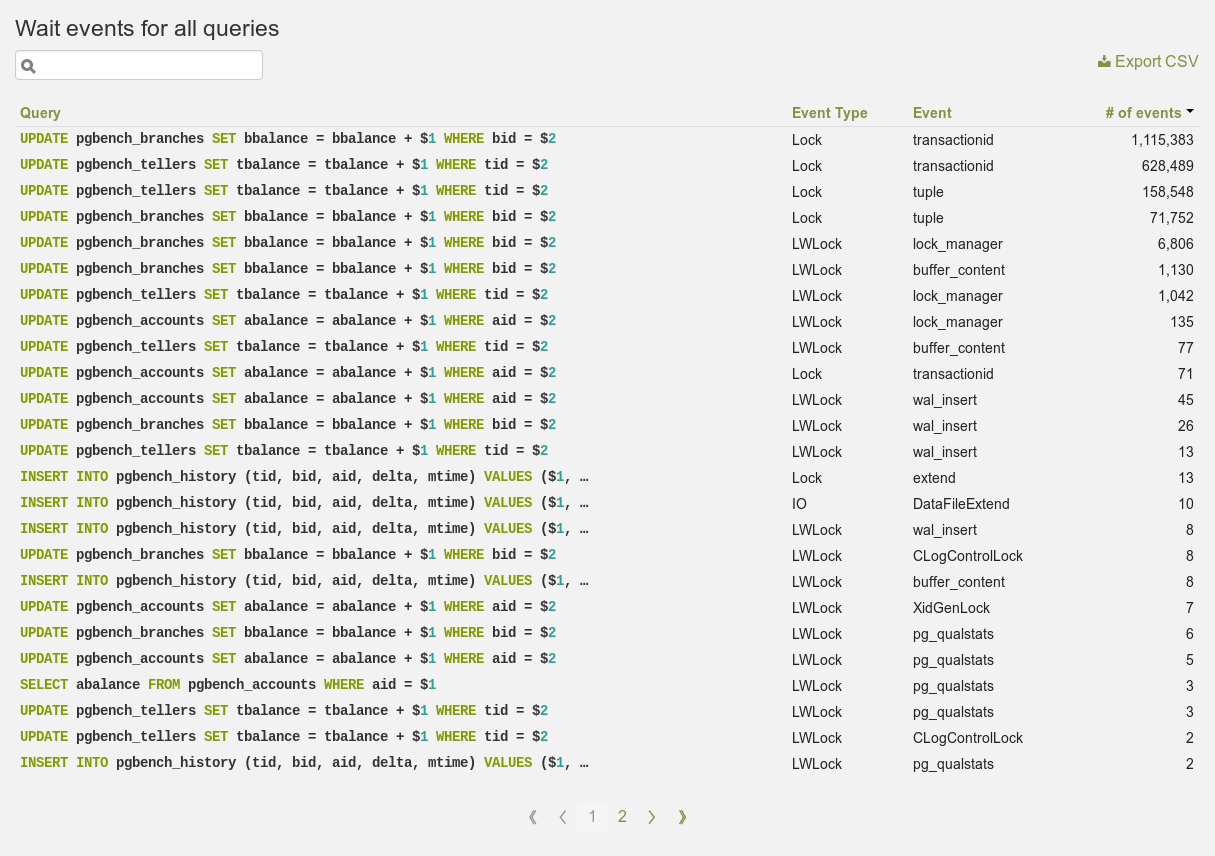
Wait events for a single query
This feature is still under development, but you can already test it using the latest git commits. I hope to add more views of those data in the near future, including some other graphs, since all the data are available. And also, if you’re a python / javascript developer, contributions are always welcome!