PoWA 4 is available in beta.
New remote mode!
The new remote mode is the biggest feature introduced in PoWA 4, though there have been other improvements.
I’ll describe here what this new mode implies and what changed in the UI.
If you’re interested in more details about the rest of the changes in PoWA 4, I’ll soon publish other articles for that.
For the most hurried people, feel free to directly go on the v4 demo of PoWA, kindly hosted by Adrien Nayrat. No credential needed, just click on “Login”.
Why is a remote mode important
This feature has probably been the most frequently asked since PoWA was first released, back in 2014. And that was asked for good reasons, as a local mode have some drawbacks.
First, let’s see how was the architecture up to PoWA 3. Assuming an instance with 2 databases (db1 and db2), plus one database dedicated for PoWA. This dedicated database contains both the stat extension required to get the live performance data and to store them.

A custom background worker is started by PoWA, which is responsible for taking snapshots and storing them in the dediacted powa database regularly. Then, using powa-web, you can see the activity of any of the local databases querying the stored data on the dedicated database, and possibly connect to one of the other local database when complete data are needed, for instance when using the index suggestion tool.
With version 4, the architecture with a remote setup change quite a lot:

You can see the a dedicated powa database is still required, but only for the stat extensions. Data are now stored on a different instance. Then, the background worker is replaced by a new collector daemon, which reads the performance data from the remote servers, and store them on the dedicated repository server. Powa-web will then be able to display the activity connecting on the repository server, and also on the remote server when complete data are needed.
In short, with the new remote mode introduced in this version 4:
- a PostgreSQL restart is not required anymore to install powa-archivist extension, as the background worker is not mandatory anymore
- there is no overhead due to storing and querying data on the same PostgreSQL server as your production server (there are still some part of the UI that requires querying the original server, for instance when showing EXPLAIN plans, but that’s a negligible overhead)
- it’s now possible to use PoWA on a hot-standby server
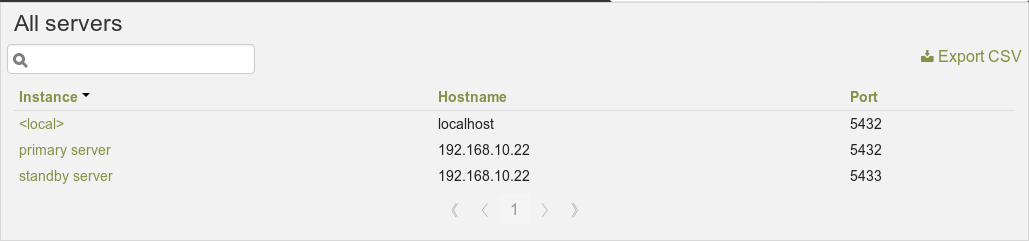
The UI will therefore now welcome you with a initial page to let you chose
which server stored on the configured database you want to wotk on:
The main reason it took so much time to bring a remote mode is because this adds quite some complexity, requiring a major rewrite of the whole PoWA stack. We also wanted to add more feature first, such as the global index suggestion, with validation using hypopg introduced with PoWA 3.
Changes in powa-web
The user interface is the component which probably has the most visible changes in this version 4. Here are the most important ones.
Remote mode compatibility
The biggest change is obviously the support for the new remote mode. As a consequence, the first page shown is now a server selector page, displaying all registered remote servers. After choosing the wanted remote server (or local server if you don’t use the remote mode), all other pages will be similar to the one that were available until PoWA 3, but displaying data for a specific remote server only, and of course retrieving the data from the repository powa database, and with some new information I’ll describe just after.
Note that as the data is now stored on a dedicated repository server when using the remote mode, most of the UI is usable without connecting on the currently selected remote server. However, powa-web still requires to connect on the remote server when the original data are needed (for instance, for index suggestion or when showing EXPLAIN plans). The same authentication considerations and possibilities as for the new powa-collector daemon (which will be described in a following article) applies here.
pg_track_settings support
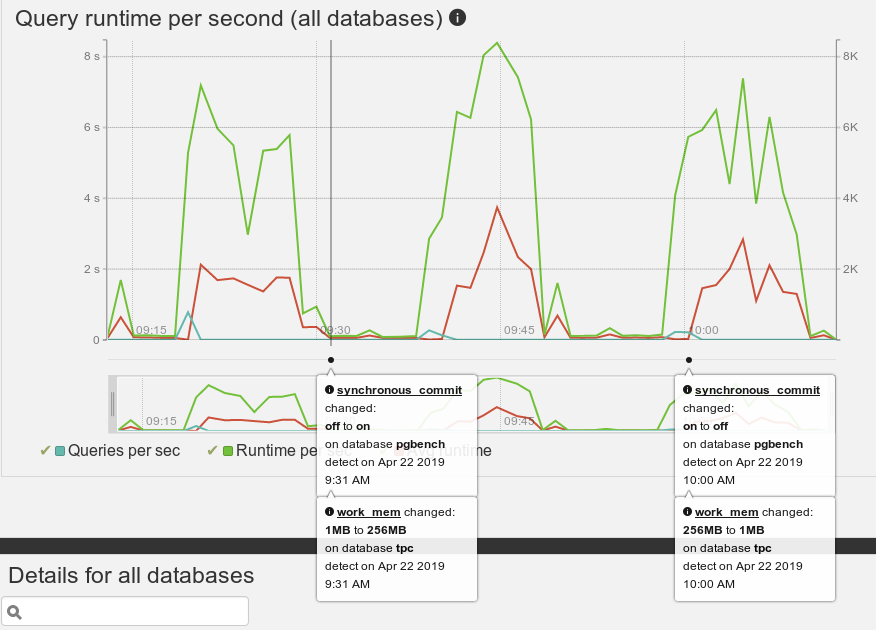
When this extension is properly configured, a new timeline widget will appear, placed between each graph and its overview, displaying any kind of recorded change if any was detected in the currently selected time interval. On the per-database and per-query pages, this list will be filtered by the selected database.
The same timeline will be displayed on every graph of each page, to easily check if this change had any visible impact using the various graphs.
Note that details of the changes will be displayed on mouseover. You can also click on any event on the timeline to make the event stay displayed, and draw a vertical line on the underlying graph.
Here’s an example of such detected configuration change in action:
Please also note that you need at least version 2.0.0 of pg_track_settings, and that the extension has to be installed both on the remote servers and the repository server.
New graphs available
When pg_stat_kcache is setup, its information were previously only displayed on the per-query page. They’re now displayed on per-server and per-database too, in two graphs:
- in the Block Access graph, where the OS cache and disk read metrics will replace the read metric
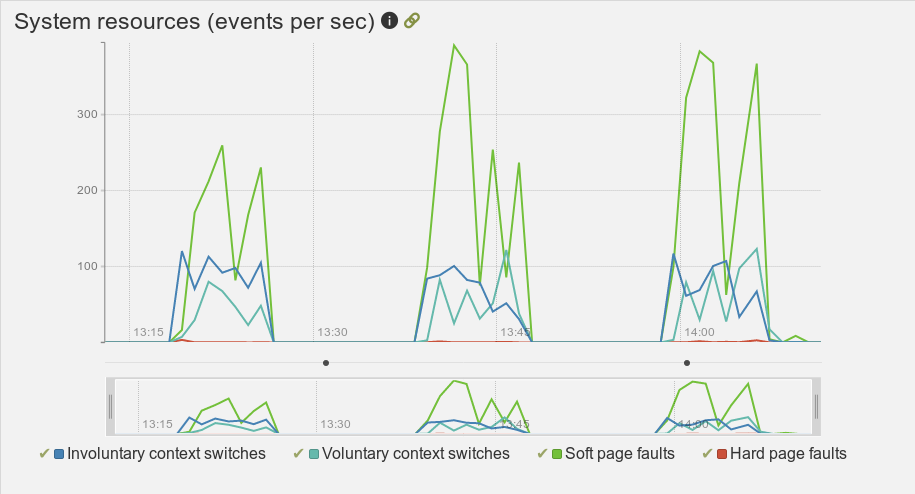
- in a new System Resources graph (which is also added in the per-query page), showing the metrics added in pg_stat_kcache 2.1
Here is an example of this new System Resources graph:
There was also a Wait Events graph (available when pg_wait_sampling extension is setup) only available on the per-query page. This graph is now available on the per-server and per-database pages too.
Metrics documentation and documentation link
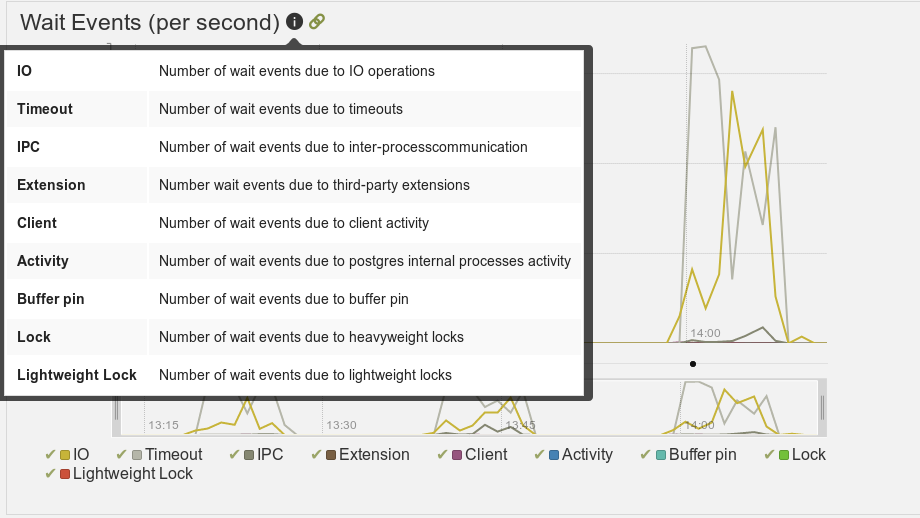
Some metrics displayed in the user interface was quite self explanatory, while some could be a little bit obscure. Unfortunately, until now there wasn’t any documentation for any of the metrics. That’s now fixed, and all graphs have an information icon, that will display a description of the metrics used in the graph on mouseover. Some graphs will also include a link to the underlying stat extension in PoWA documentation for users who want to learn more about them.
Here’s an example:
And general bugfixes
Some longstanding issues were also reported:
- the graph hover box showing metric values had a wrong vertical position
- the time selection using the graph preview didn’t show a correct preview after applying the selection
- errors on hypothetical index creation or in certain cases their display wasn’t correctly handled in multiple pages
- grid filters weren’t reapplied when time selection was changed
If you have ever been annoyed by any of this, you’ll be glad to know that they’re now all fixed!
Conclusion
This 4th version of PoWA represents a lot of time on development, documentation improvements and testing. We’re now quite satisfied with it, but we may have missed some bugs. If you’re interested in this project, I hope that you’ll consider testing the beta, and if needed don’t hesitate to report a bug!